In this article, we explain how the signals can be computed from the variations of the inventory of the SPDR Gold Shares exchange traded trust (NYSEArca:GLD). We explain why the inventory adjustments can hardly be caused by price arbitrage between the GLD share price and the loco London spot price alone. We rather claim that bullion banks finance their inventory by lending it or selling it to GLD investors and that bullion banks manage their physical reserves by accessing the physical gold inside GLD.
The fact that a certain type of inventory adjustments has predictive power, supports the idea that large inventory changes are the result of active reserve management. This provides us with a unique window into the flow of physical gold that is usually obscured by the dominance of paper gold trading. A similar, but somewhat less robust result is shown for the iShares Silver Trust (NYSEArca:SLV).
The idea of a trading strategy based on changes to the GLD inventory goes back to Lance Lewis’ GLD Puke Indicator. The term Central Bank Of the Bullion Banks was coined by FOFOA who wrote about the GLD Puke Indicator in Who Is Draining GLD. In that article, FOFOA expands on Randal Strauss’ idea that GLD redemptions indicate a preference for physical gold over paper gold (see his Gold Dips Towards $1360/oz … and Gold Nears 3-Months Low…).
Creation and Redemption of GLD Baskets
The method by which GLD grows or shrinks differs radically from the way in which conventional investment funds operate. If you want to invest in such a fund, you wire money to the manager. If you wish to withdraw money, you fax them a withdrawal notice. Depending on the contributions and withdrawals, the manager then either invests the contributed cash or sells investments in order to satisfy the requests for withdrawal.GLD is managed differently. As of 29 May 2012, there exist about 421 million shares of the trust. Each share corresponds to roughly 0.097 ounces of gold. The trust therefore contains 40.84 million ounces of gold (1270 tonnes) that are worth $64.5bn at the London pm fixing price of $1579.50 per ounce.
The number of shares of the trust can be changed only in multiples of a basket (100000 shares) and only by the so-called Authorized Participants (APs). According to the prospectus of 26 April 2012, these are Barclays, Citigroup, Credit Suisse, Deutsche Bank, Goldman Sachs, HSBC, J.P. Morgan, Merrill Lynch, Morgan Stanley, Newedge, RBC, Scotia, UBS and Virtu Financial. Each of these APs can
- Transfer the physical gold that corresponds to a basket of shares to the trustee. The trustee then creates a basket of new shares and transfers them to the AP in return (creation)
- Transfer a basket of shares to the trustee and receive the corresponding physical gold in return. The trustee then cancels the shares (redemption).
Creation and Redemption Statistics
Before we consider why an AP might wish to create or redeem baskets, let us take a look at the statistics of these creations and redemptions. The following histogram shows the frequency of the daily inventory changes depending on their size in millions of ounces (creations are counted positive, redemptions negative). Days on which the inventory remained constant, are ignored. We have analyzed the period from 1 January 2006 to 30 April 2012. Recall that one basket consists of 100000 shares which presently represents 9700 ounces or 301.67kg of gold, worth about $15.3 million.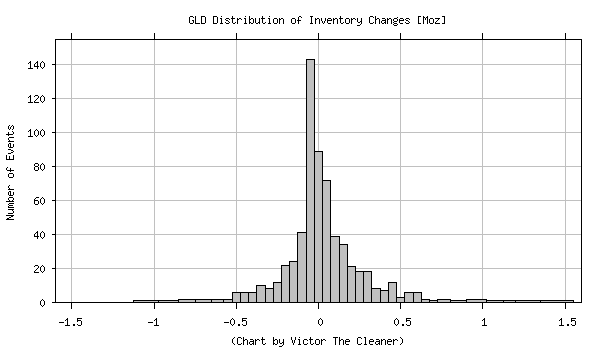
Distribution of daily GLD inventory changes in millions of ounces from 1 January 2006 to 30 April 2012
The Trading Strategy in Detail
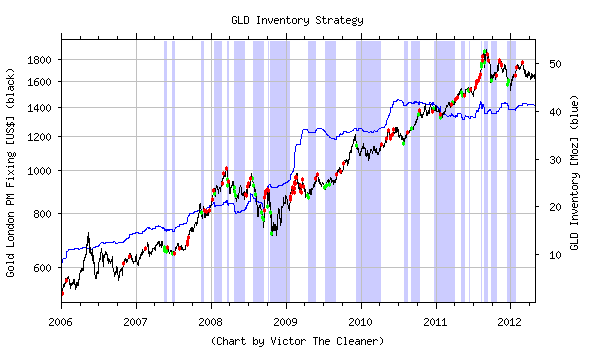
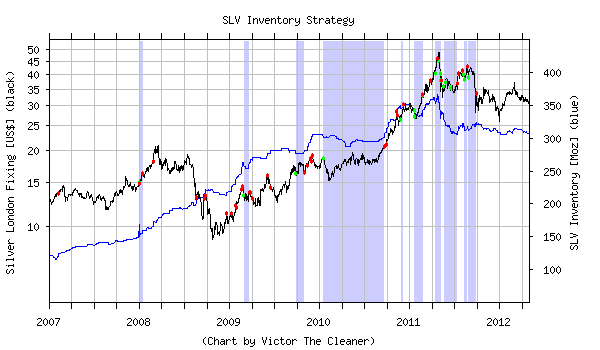
For GLD, we are interested in creations and redemptions that exceed the threshold of 250000 ounces on a single day, i.e. about 25 baskets or 7.78 tonnes (presently worth $394 million). Note that this threshold essentially captures the fat tails of the distribution of inventory changes displayed above.On the first day (1 January 2006), our strategy is not invested. At about 4.50pm New York time on every New York trading day, i.e. after the close, the current inventory of GLD is published. If the strategy is not invested and the inventory has decreased by 250000 ounces or more compared with the previous trading day, our strategy buys gold at the London pm fixing price on the following day. If the strategy is invested and on any New York trading day, the inventory has increased by 250000 ounces or more, our strategy sells the gold at the London pm fixing price on the following day. These buy and sell signals are indicated by the green and red dots in the chart at the beginning of this article. The blue curve (right scale) shows the total inventory of GLD in millions of ounces.
Recall that the original GLD Puke Indicator by Lance Lewis counts a decrease of the inventory by 1% or more as a buy signal. We prefer an absolute threshold (250000 ounces) rather than a relative one. This yields a more consistent performance of the strategy over the entire period from 2006 to 2012 and is also more plausible in view of our interpretation of the inventory changes as reserve management (details below). Note that GLD began trading on 18 November 2004, and we have omitted the first 13.5 months from the analysis.
Of course, nobody would actually trade according to this strategy, simply because even during the times at which the strategy is not invested, the gold price still increases at an annualized rate of 7.9%. The strategy merely serves to demonstrate that inventory changes do have some power of predicting the future gold price.
Price Arbitrage
Let us now consider why an Authorized Participant (AP) might wish to create or redeem baskets of GLD. We therefore need to understand how GLD is priced and which type of arbitrage might enforce this price.Assume you know from the data sheet that one share of GLD corresponds to 0.097 ounces of gold and that the London spot price is $1579.50 per ounce. This yields a Net Asset Value (NAV) of $153.21 per share. Even if you do not know the price at which GLD is currently trading, you nevertheless know that one share of GLD is worth $153.21. So if you bid $153.21 per share (plus spread), you should be able to purchase your shares of GLD, simply because GLD contains physical gold loco London that you could equally well purchase directly for the spot price (plus spread).
If you bid less than $153.21, you cannot expect to receive any shares, simply because the seller would be foolish to sell at this price. If you bid more than $153.21, you would effectively hand a free lunch to the seller. In fact, if you did, your counterparty can indeed capture this free lunch by arbitrage.
Paper Gold Arbitrage
Suppose there is a buyer of GLD shares who acts foolishly and who drives up the price of GLD shares well beyond their NAV. Any arbitrageur can now go short GLD and long any other gold investment that follows the London spot price. This allows him to capture the arbitrage, i.e. to lock in a risk-free profit. This works because GLD will eventually trade at its NAV again, and the arbitrageur can unwind both positions at that point in time. We call this form of arbitrage paper gold arbitrage because the arbitrageur can go long unallocated gold in addition to short GLD while the physical gold inside GLD is not touched.If for some reason, GLD trades at a discount to its NAV, the arbitrageur can go long GLD and short paper gold. Most likely, GLD will sometimes trade at a small premium to NAV and at other times at a small discount, and so the arbitrageur can easily unwind the paper gold arbitrage after a short period of time.
Let us stress that paper gold arbitrage should be largely unnecessary though, simply because every investor knows that the NAV is the price at which GLD ought to trade. Deviating from this price would be foolish, and so in most cases the threat of arbitrage ought to be sufficient in order to keep the market efficient while the actual arbitrage would not be necessary.
In the unlikely event that there is so much buying pressure that GLD consistently trades at a premium even though paper gold arbitrage is performed, the short GLD and long unallocated gold positions of the arbitrageur would keep growing. How can this be avoided?
Creation-Redemption Arbitrage
The answer is that if an AP performs such an arbitrage and his position of short GLD versus long unallocated gold has grown beyond the size of a basket, he can unwind the position at any time by having a basket created, i.e. he- has a basket worth of his unallocated gold allocated,
- transfers the gold to the trustee,
- receives a basket of created shares,
- uses these shares in order to close his short position in GLD.
- transfers a basket of shares to the trustee for redemption,
- receives a basket worth of allocated gold,
- uses this gold in order to close his short unallocated position.
Due to the transaction costs, the APs will avoid the creation-redemption arbitrage as far as possible and perform it only if their paper gold arbitrage position gets way out of balance. Let us finally recall that every market participant knows the NAV and the spot price and therefore the fair price of a GLD share, and so even paper arbitrage should normally be unnecessary.
Then why do we see so many inventory adjustments? Is there a second reason for adjusting the inventory beyond the obvious price arbitrage?
Two Different Views on Inventory Changes
How can we better understand the creation and redemption of baskets? The arbitrage point of view was the following:Some investor decides to buy a certain number of GLD shares, but he is not interested in other gold investments. If he is willing to pay a premium for these GLD shares if necessary, he will definitely get the desired number of shares. The price to pay is that an AP who acts as the arbitrageur, can pocket that premium as a profit for the service of creating the desired number of shares.
There is, however, a second point of view on the creation and redemption that is not centred around the GLD investor, but rather around the AP. Let us assume the AP decides to put a certain amount of gold into GLD. He therefore transfers the gold to the trustee, receives GLD shares in turn and sells these shares into the market. If GLD shares trade at a discount as the consequence, the rest of the market can act as the arbitrageur and, for example, slightly favour GLD over other gold investments, and thereby absorb all the newly created GLD shares.
So which one is it? Do the investors in GLD request a certain number of shares, and the AP delivers by performing the arbitrage and creating the shares? Or does the AP decide to place a certain amount of gold into GLD, and then the market absorbs these additional shares?
We suspect that at least those inventory adjustments that constitute the fat tails of the distribution, i.e. beyond the threshold of 250000 ounces per day, are in effect initiated by the AP rather than by the GLD investors.
If it were just the arbitrage in response to the investors, why would the trading strategy work? The only explanation would be that GLD investors represent the ‘dumb money’ (or ‘weak hands’) whereas all other gold investments represent the ‘smart money’ (‘strong hands’). In this scenario, GLD would lose a significant amount of inventory when the dumb money sells while the smart money buys, triggering a buy signal. Conversely, when the smart money sells and the dumb money buys, GLD would gain inventory which constitutes a sell signal.
The problem with this view is, however, that there is no reason to assume that GLD is held primarily by the weak hands whereas the other gold investments that are all tied to the London spot price, represent the strong hands. Both GLD and unallocated gold OTC or COMEX futures are held by sophisticated investors, endowment funds or hedge funds. Although many retail investors, i.e. typically weak hands, are in GLD, the same is true for other gold investments such as coins and retail bars, COMEX futures, and bank sponsored gold-related products that, in aggregate, all appear on the other side of the arbitrage, i.e. in the spot market outside of GLD.
The only consistent interpretation would be the following: The fact that the suggested trading strategy works, confirms that in aggregate GLD is dominated by weak hands whereas in aggregate all other gold investments are dominated by strong hands. This point of view is not plausible at all.
We therefore suspect that those inventory adjustments that are relevant to our trading strategy, i.e. those beyond 250000 ounces per day that form the fat tails, are rather initiated by the APs.
Inventory Financing and Reserve Management
Why would an AP decide to increase or decrease the inventory of GLD other than in order to capture some arbitrage profit? There are two plausible scenarios. In order to understand them, let us first note that all market makers except two (Mitsui and Société Générale) and all clearing members of the London Bullion Market Association (LBMA) are presently APs of GLD.Inventory Financing
Consider a company whose operation requires an expensive inventory. In order to stay in the realm of the gold market, this might be a large coin store, a refiner or mint, or even the market maker of a public exchange. The regular operation requires a considerable gold inventory, but this inventory ties up a lot of capital.In order to reduce the capital requirement, our company has several options, for example,
- To take out an unsecured loan in order to finance the inventory. This is usually an expensive strategy.
- To Take out a loan for which the inventory serves as the collateral. Given that the inventory is gold bullion, the collateral is easy to liquidate, and so the interest expenses on such a loan should be a significantly lower than those on an unsecured loan.
- To swap the gold for dollars with a bullion bank, i.e. our company borrows dollars from the bank and at the same time lends gold to the bank, both for a fixed term. This is almost the same as taking out a loan that is secured by the gold. Since such swaps are typically limited to 400oz LGD bars, this method is suitable for the market maker, but not for the coin dealer or for the refiner.
- To give private investors an opportunity to own a part of the inventory. The pooled accounts offered by Kitco or by the Perth Mint are examples of this type of inventory financing. Our company can sell the title to gold that forms part of the inventory, to private investors and offer to buy it back from them. Such a pooled account is indeed backed by physical gold, but this is the physical gold that flows through our inventory anyway. Voila, somebody else owns our inventory, and our capital is no longer tied up in order to hold this very inventory.
Even better, should the portion of the inventory corresponding to this flow decrease unexpectedly, they can even purchase a basket of GLD shares in the market, redeem them and recover the gold at any time. In this sense, GLD is even superior to the Kitco pooled account. Kitco can decrease their inventory only if some of the investors in their pooled account decide to sell. GLD offers the advantage that there is a liquid market for GLD shares from which the bullion bank can purchase additional shares at any time. The average daily trading volume of GLD is about 12 million shares which represents an inventory of 1.16 million ounces or 36.2 tonnes.
Reserve Management
A second use of GLD for the bullion bank besides the financing of a part of their inventory is reserve management. This plays a role for every institution that accepts bank deposits in ounces, that lends ounces and that holds only a fractional reserve of physical gold against this created credit. For example balance sheets, we refer to Bullion Banking with Alice and Bob.The bullion bank can hold gold instruments in various forms, for example,
- physical gold in the vault,
- allocated balances with other institutions,
- shares of GLD,
- unallocated balances with other institutions,
- outstanding loans denominated in ounces,
- long OTC Forward or COMEX futures positions,
- and many others.
Besides the credit risk, i.e. the risk that a counterparty fails to honour its obligations, any bullion bank that holds only a fractional reserve against their customers’ deposits, is exposed to liquidity risk. For example, customers might request allocation of their unallocated account balances. In this case, both a liability of the bank (the customers’ unallocated account balance) and an asset (a reserve of physical gold) disappear from the balance sheet. This is analogous to a customer withdrawing dollars in cash from a commercial bank or to a customer transferring out credit money from her account.
Since such a withdrawal involves a reduction of our bullion bank’s reserves, our reserve ratio deteriorates. We now have less reserves relative to the size of our balance sheet. This is where GLD comes in handy. We can easily replenish our reserves by
- selling unallocated gold or other instruments that involve credit or counterparty risk, and
- purchasing shares of GLD, and optionally
- redeeming these shares for physical gold.
Shortage of Reserves and Reduction of GLD Inventory
Although inventory financing may be one of the motivations for establishing GLD and for the APs to place additional gold in GLD, it is not the activity that correlates with the inventory changes on which our trading strategy is based. The reason is that our strategy is based on the creation and redemption of GLD baskets, but inventory financing occurs when a bullion bank sells existing shares of GLD to an investor.Let us try to disentangle these steps. The bullion banks presumably hold a part of their reserve in the form of physical gold in their own vault and another part in the form of GLD shares. Whenever they acquire a larger amount of additional physical reserves, they probably place some of it into GLD and create new baskets of shares, but they do not necessarily sell these GLD shares to investors and even if they do, this need not happen at the same point in time.
Conversely, if a bullion bank faces a large allocation request and needs to replenish the physical gold in their vault, they can redeem baskets of GLD that they already own. In a true emergency in which a bullion bank runs out of reserves, they can even
- sell some paper gold, and
- purchase GLD shares with the proceeds, and optionally
- redeem these GLD shares in order to receive physical gold,
Since our trading strategy uses only the instances in which shares of GLD are redeemed for physical gold, it is sensitive to the following two situations:
- The bullion bank has purchased shares of GLD in order to boost its reserves. In order to achieve a balance between their two forms of reserves, i.e. GLD and physical gold in the vault, they redeem some of these GLD shares.
- There has been a request for allocation by some investor who requires individual bars in the vault, and so GLD shares need to be redeemed in order to get to the bars.
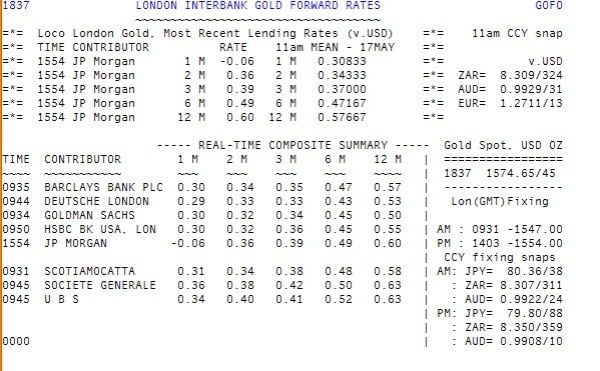
One of the largest recent reductions in GLD inventory occurred on 22 May 2012 with a net redemption of 563024 ounces, i.e. 58 baskets or about 17.5 tonnes. This event coincides up to one week with a negative one-month GOFO quoted by J.P. Morgan on 16 May 2012 as reported by Izabella Kaminska. This indicates that J.P. Morgan was presumably willing to pay a premium in order to swap dollars for gold, i.e. they were willing to buy at spot and sell a one-month forward at a discount.
Robert LeRoy Parker spotted another example. Some of the largest reductions in GLD inventory occurred on 23 and 24 August 2011 with redemptions of 798417 ounces and 876288 ounces, together 172 baskets or about 52 tonnes of gold. This coincides with the following reported Gold Forward Offered Rates (GOFO) found on the LBMA website at that time. The numbers are GOFO for 1,2,3,6 and 12 months:
19-Aug-11 0.40000 0.41600 0.42600 0.48800 0.51000The term structure beyond one month was inverted on 22 August 2011, indicating that some bullion bank(s) frantically tried to borrow gold in the OTC market, gold that was needed within one to two months. They were willing to buy one-month forward and sell a longer forward at a discount. Recall that the GOFO rates reported on the LBMA website are not individual quotes that can be associated with a specific bullion bank, but rather the averages from their daily telephone survey of the major market makers. Also note that a few days later, these numbers were ‘corrected’ on the LBMA website.
22-Aug-11 0.48250 0.43000 0.35000 0.25000 0.08750
23-Aug-11 0.40800 0.41600 0.42250 0.50000 0.52600
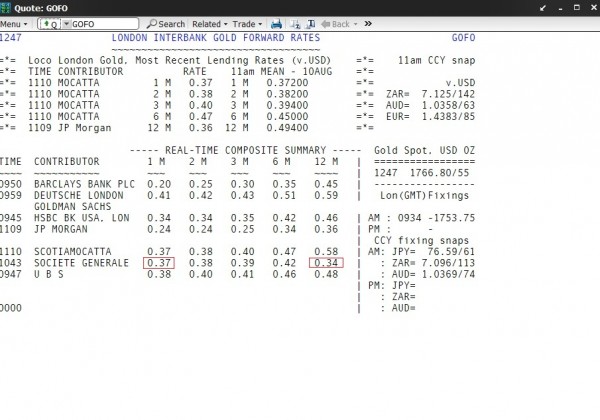
A third example was again reported by Izabella Kaminska. On 10 August 2011, Société Générale quoted an inverted term structure:
Again, this coincides with losses of GLD inventory of 418373 ounces on 9 August 2011, 759559 ounces on 11 August 2011 and 408988 ounces on 12 August 2011, together 1.59 million ounces, 164 baskets or 49.3 tonnes. Since Société Générale is not an AP, apparently someone else took the gold out of GLD and lent it to them.
We have to concede that the published GLD inventory only records the aggregate daily changes. The fax from HSBC that Warren James at Screwtape Files discovered, shows redemptions of 759618 ounces for 16 August 2011. This must have been some intra-day movement that was compensated by even larger creations on the same day because the reported aggregate change of inventory for that day is positive. Apparently the inventory changes are such a good indicator that the trading strategy is still effective even if we work with daily aggregates only.
Interpretation
We arrive at the interpretation that large allocation requests by customers of a bullion bank sometimes force the bullion bank to take physical gold out of GLD. This is a buy signal that indicates a higher price of paper gold in the near future. Conversely, once the bullion bank has replenished its reserve of physical gold and shifts a part of this back into GLD, this forms a sell signal that indicates a less rapidly increasing price of paper gold in the near future.FOFOA must have had this picture in mind when he called GLD the Central Bank of the Bullion Banks, i.e. a depository of additional reserves shared by those bullion banks that are at the same time APs.
It remains to understand why the paper price of gold rises during the period immediately following strong demand for physical gold.
Conservative Interpretation
A simple explanation is the following. Many large redemptions of GLD occur towards the end of a sell-off in the price of paper gold. There might be some sophisticated buyer(s) of physical gold who buy the dips and whose timing is excellent.Notice that the buyer(s) purchase only about 5 to 50 tonnes of physical gold on the relevant days whereas about 2700 tonnes of paper gold are sold every trading day (total transaction volume of all sales, assuming 62.5 trading days per quarter) according to the Loco London Liquidity Survey published in August 2011. Although the physical purchase is tiny compared to the trading volume of paper gold, after this purchase the price of paper gold increases.
We might attribute this to the excellent timing of the large physical buyer whose activity we can sometimes spot by watching the inventory of GLD.
Speculative Interpretation
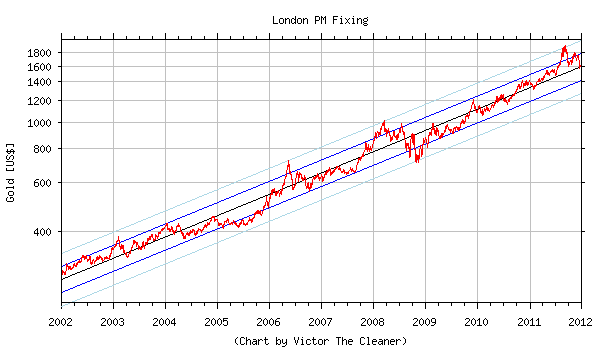
If you find this interpretation unsatisfactory and ask why should the paper price increase after the purchase of an amount of allocated gold that is small compared to the volume of paper gold traded, the only way out is more speculative.What if somebody manages the price of paper gold in such a way as to control the flow of physical gold? The following chart shows the remarkably uniform increase in the dollar price of gold over the previous decade from 2002 to 2011. The black line is the regression line in the logarithmic diagram. It starts on 2 January 2002 at $266.60 and ends on 29 December 2011 at $1589.95 for an annual rate of increase of 19.56%. The blue and light blue bands are a factor of 1.118 and 1.25 away from the black line.
Does this chart look ‘managed’? Maybe…
How would one manage the price in such a way as to control the flow of physical gold? Let us make up some numbers in order to arrive at a toy model. There is a flow of new gold into the market from mining and recycling. This amounts to about 3000 tonnes per year. If a third of this amount goes through the London market, this amounts to about 4 tonnes per trading day (assuming 250 trading days per year).
In addition, there are some investors who sell allocated gold and some who purchase allocated gold. Let us be generous and assume that this trading volume of allocated gold is three times as big as the flow of new gold. This suggests a trading volume of 16 tonnes of physical gold per trading day in the London market which is tiny compared to the trading volume of paper gold (2700 tonnes per trading day). It is important to keep in mind that the inflow of new gold has an approximately constant weight per day.
It firstly seems plausible that allocation requests of about 5 to 50 tonnes are big enough in order to affect the reserve management of the bullion banks and thereby result in changes to the GLD inventory. It is also plausible that the management of the physical reserve that underlies the gold market is a rather delicate business because the paper trading volume is so huge compared to the physical volume.
Secondly, let us assume that the allocation requests by the buyers of physical gold involve an approximately constant sum of dollars per time. Investors or central banks who gradually switch from dollars into gold or who gradually diversify their foreign exchange reserves. We therefore have an inflow of physical gold that is steady in terms of weight per time, but an outflow that is steady in terms of dollars per time.
In order to manage the flow of physical gold, someone might therefore try to manage the dollar price of paper gold. Since the physical inflow is by weight, but the outflow by dollars, one might try to increase the paper price in response to an increased outflow of physical gold and try to lower the paper price whenever there are plenty of reserves. There you go. This is indeed consistent with what we see in our trading strategy: The price of paper gold increases in response to an outflow of physical gold.
Let us keep this speculation in mind as a second possible explanation of why the trading strategy works.
In light of this interpretation, it would be worthwhile watching the total inventory of GLD (the blue curve, right scale, in the very first diagram of this article). The inventory of GLD, the central bank of the bullion banks, should move in line with their total physical reserves. We see that the inventory peaked at 42.1 million ounces (1310 tonnes) in summer 2010, a level that has not been reached ever since. Even though the dollar price of gold rose further from $1200/ounce to $1900/ounce, the investors in GLD were not able to entice the APs to make additional inventory available.
Nevertheless, the present GLD inventory of still 40.84 million ounces (1270 tonnes) forms a considerable reserve of physical gold which the bullion banks can draw on in order to replenish their own reserves. Should the total inventory continue to decline, this would indicate increasing pressure on the physical reserves of the bullion banks. The financial media, however, would presumably tell you that investors are no longer interested in gold, that they sold their shares in GLD and that this was bearish for gold. Nothing would be further from the truth.
The SLV Inventory Strategy
The same trading strategy that we developed for gold, can also be applied to silver. We therefore watch the inventory of the iShares Silver Trust (SLV) whose inventory management is organized in the same way as that of GLD. Note that a share of SLV presently represents about 0.97 ounces of silver. One basket consists of 50000 shares, i.e. about 1.5 tonnes of silver presently worth $1.37 million (London silver fixing of $28.25/ounce on 29 May 2012).The following histogram shows the distribution of the daily changes to the inventory of SLV.
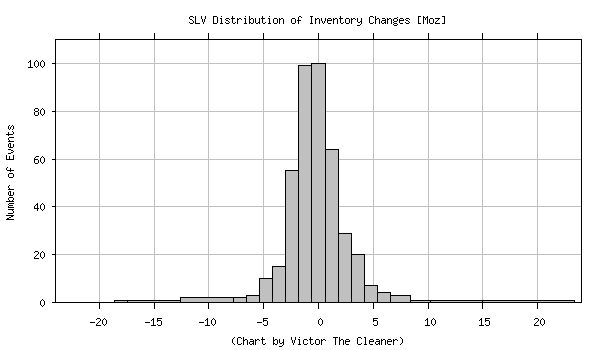
Distribution of daily SLV inventory changes in millions of ounces from 1 January 2007 to 30 April 2012
The following chart finally shows the performance of this strategy. The black curve (left scale) is the London Silver Fixing in U.S. Dollars. Again, buy and sell signals are indicated by green and red dots, respectively, and the light-blue shaded areas are the times during which the strategy is invested, i.e. about 25% of the time. During the invested periods, the silver price increases at an annualized rate of 28.7% whereas during the remaining times it increases only at an annualized rate of 11.6%. The blue curve (right scale) finally shows the total inventory of SLV.
Whereas in the case of GLD, basically any threshold beyond our 250000 ounces works, as long as it gives a sufficient number of signals at all, it is substantially more difficult to find efficient parameters for the strategy involving SLV and silver. Nevertheless, we do have an effective trading strategy, and so everything said about reserve management and GLD seems to apply to silver and SLV, too.
Comments
If you have comments, suggestions or corrections concerning this article, please comment here (comments are moderated, and it may take a while until I have time to check for new comments). FOFOA just opened a new thread GLD Talk Continued, and so for the further discussion, please take a look there.http://victorthecleaner.wordpress.com/2012/06/01/gld-the-central-bank-of-the-bullion-banks/
